Update to Trinity Study Tables
The original Trinity Study measured returns from 1945 through 1995, a 50-year period. Here are the same tables updated to measure 90 years 1926 through 2014:
The Trinity Study Tables
Table 1:
Portfolio Success Rate: Percentage of all Past Payout Periods From 1926 to 1995 That are Supported by the Portfolio
Note: Numbers in the table are rounded to the nearest whole percentage. The number of overlapping 15-year payout periods from 1926 to 1995, inclusively, is 56; 20-year periods, 51; 25-year periods, 46; 30-year periods, 41. Stocks are represented by Standard and Poor's 500 Index, and bonds are represented by long-term, high-grade corporates.
One page "invest like the rich" cheat sheet provides short explanations of how the rich investment differently. You don't need to be rich to copy what they do. Download now.
Data source: Calculations based on data from Ibbotson Associates.
PortfolioComposition/Payout Period |
Withdrawal Rate as a % of Initial Portfolio Value |
|||||||||
| 3 | 4 | 5 | 6 | 7 | 8 | 9 | 10 | 11 | 12 | |
| 100% Stocks | ||||||||||
| 15 Years | 100 | 100 | 98 | 98 | 93 | 91 | 88 | 77 | 63 | 55 |
| 20 Years | 100 | 98 | 96 | 94 | 92 | 84 | 73 | 61 | 47 | 43 |
| 25 Years | 100 | 98 | 96 | 91 | 87 | 78 | 70 | 50 | 43 | 35 |
| 30 Years | 100 | 98 | 95 | 90 | 85 | 78 | 68 | 54 | 49 | 34 |
| 75% Stocks-25% Bonds | ||||||||||
| 15 Years | 100 | 100 | 100 | 100 | 96 | 95 | 91 | 79 | 63 | 46 |
| 20 Years | 100 | 100 | 100 | 96 | 94 | 88 | 71 | 51 | 41 | 33 |
| 25 Years | 100 | 100 | 98 | 96 | 91 | 78 | 57 | 46 | 33 | 26 |
| 30 Years | 100 | 100 | 98 | 95 | 88 | 73 | 54 | 46 | 37 | 24 |
| 50% Stocks-50% Bonds | ||||||||||
| 15 Years | 100 | 100 | 100 | 100 | 100 | 98 | 91 | 71 | 50 | 36 |
| 20 Years | 100 | 100 | 100 | 100 | 96 | 88 | 61 | 41 | 25 | 10 |
| 25 Years | 100 | 100 | 100 | 98 | 96 | 70 | 43 | 22 | 7 | 0 |
| 30 Years | 100 | 100 | 100 | 98 | 90 | 51 | 37 | 15 | 0 | 0 |
| 25% Stocks-75% Bonds | ||||||||||
| 15 Years | 100 | 100 | 100 | 100 | 100 | 100 | 91 | 50 | 21 | 14 |
| 20 Years | 100 | 100 | 100 | 100 | 100 | 71 | 24 | 12 | 4 | 2 |
| 25 Years | 100 | 100 | 100 | 100 | 78 | 22 | 9 | 0 | 0 | 0 |
| 30 Years | 100 | 100 | 100 | 100 | 32 | 5 | 0 | 0 | 0 | 0 |
| 100% Bonds | ||||||||||
| 15 Years | 100 | 100 | 100 | 100 | 100 | 79 | 43 | 38 | 14 | 7 |
| 20 Years | 100 | 100 | 100 | 96 | 47 | 35 | 16 | 6 | 0 | 0 |
| 25 Years | 100 | 100 | 98 | 52 | 26 | 7 | 2 | 0 | 0 | 0 |
| 30 Years | 100 | 100 | 51 | 27 | 0 | 0 | 0 | 0 | 0 | 0 |
The Trinity Study Tables
Table 2:
Portfolio Success Rate: Percentage of all Past Payout Periods From 1946 to 1995 That are Supported by the Portfolio
Note: Numbers in the table are rounded to the nearest whole percentage. The number of overlapping 15-year payout periods from 1946 to 1995, inclusively, is 36; 20-year periods, 31; 25-year periods, 26; 30-year periods, 21. Stocks are represented by Standard and Poor's 500 Index, and bonds are represented by long-term, high-grade corporates.
Data source: Calculations based on data from Ibbotson Associates.
Portfolio Composition/ Payout Period |
Withdrawal Rate as a % of Initial Portfolio Value |
|||||||||
| 3 | 4 | 5 | 6 | 7 | 8 | 9 | 10 | 11 | 12 | |
| 100% Stocks | ||||||||||
| 15 Years | 100 | 100 | 98 | 98 | 93 | 91 | 88 | 77 | 63 | 55 |
| 20 Years | 100 | 98 | 96 | 94 | 92 | 84 | 73 | 61 | 47 | 43 |
| 25 Years | 100 | 98 | 96 | 91 | 87 | 78 | 70 | 50 | 43 | 35 |
| 30 Years | 100 | 98 | 95 | 90 | 85 | 78 | 68 | 54 | 49 | 34 |
| 75% Stocks-25% Bonds | ||||||||||
| 15 Years | 100 | 100 | 100 | 100 | 96 | 95 | 91 | 79 | 63 | 46 |
| 20 Years | 100 | 100 | 100 | 96 | 94 | 88 | 71 | 51 | 41 | 33 |
| 25 Years | 100 | 100 | 98 | 96 | 91 | 78 | 57 | 46 | 33 | 26 |
| 30 Years | 100 | 100 | 98 | 95 | 88 | 73 | 54 | 46 | 37 | 24 |
| 50% Stocks-50% Bonds | ||||||||||
| 15 Years | 100 | 100 | 100 | 100 | 100 | 98 | 91 | 71 | 50 | 36 |
| 20 Years | 100 | 100 | 100 | 100 | 96 | 88 | 61 | 41 | 25 | 10 |
| 25 Years | 100 | 100 | 100 | 98 | 96 | 70 | 43 | 22 | 7 | 0 |
| 30 Years | 100 | 100 | 100 | 98 | 90 | 51 | 37 | 15 | 0 | 0 |
| 25% Stocks-75% Bonds | ||||||||||
| 15 Years | 100 | 100 | 100 | 100 | 100 | 100 | 91 | 50 | 21 | 14 |
| 20 Years | 100 | 100 | 100 | 100 | 100 | 71 | 24 | 12 | 4 | 2 |
| 25 Years | 100 | 100 | 100 | 100 | 78 | 22 | 9 | 0 | 0 | 0 |
| 30 Years | 100 | 100 | 100 | 100 | 32 | 5 | 0 | 0 | 0 | 0 |
| 100% Bonds | ||||||||||
| 15 Years | 100 | 100 | 100 | 100 | 100 | 79 | 43 | 38 | 14 | 7 |
| 20 Years | 100 | 100 | 100 | 96 | 47 | 35 | 16 | 6 | 0 | 0 |
| 25 Years | 100 | 100 | 98 | 52 | 26 | 7 | 2 | 0 | 0 | 0 |
| 30 Years | 100 | 100 | 51 | 27 | 0 | 0 | 0 | 0 | 0 | 0 |
The Trinity Study Tables
Table 3:
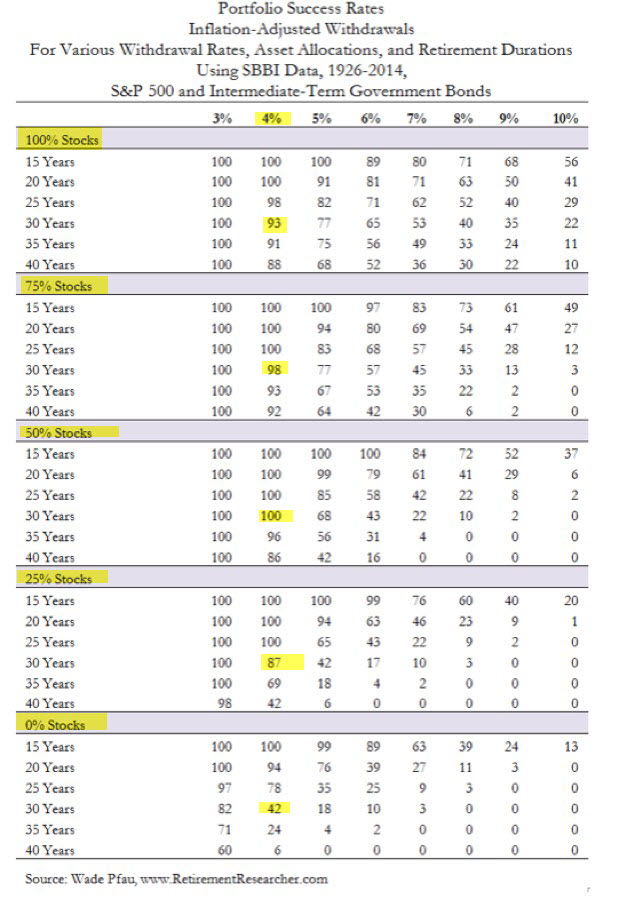
Portfolio Success Rate: Percentage of all Past Payout Periods From 1926 to 1995 that are Supported by the Portfolio After Adjusting Withdrawals for Inflation and Deflation
Note: Numbers in the table are rounded to the nearest whole percentage. The number of overlapping 15-year payout periods from 1926 to 1995, inclusively, is 56; 20-year periods, 51; 25-year periods, 46; 30-year periods, 41. Stocks are represented by Standard and Poor's 500 Index, bonds are represented by long-term, high-grade corporates, and inflation (deflation) rates are based on the Consumer Price Index (CPI). Data source: Calculations based on data from Ibbotson Associates.
| Portfolio Composition/ Payout Period |
Withdrawal Rate as a % of Initial Portfolio Value |
|||||||||
| 3 | 4 | 5 | 6 | 7 | 8 | 9 | 10 | 11 | 12 | |
| 100% Stocks | ||||||||||
| 15 Years | 100 | 100 | 100 | 91 | 79 | 70 | 63 | 55 | 43 | 34 |
| 20 Years | 100 | 100 | 88 | 75 | 63 | 53 | 43 | 33 | 29 | 24 |
| 25 Years | 100 | 100 | 87 | 70 | 59 | 46 | 35 | 30 | 26 | 20 |
| 30 Years | 100 | 95 | 85 | 68 | 59 | 41 | 34 | 34 | 27 | 15 |
| 75% Stocks-25% Bonds | ||||||||||
| 15 Years | 100 | 100 | 100 | 95 | 82 | 68 | 64 | 46 | 36 | 27 |
| 20 Years | 100 | 100 | 90 | 75 | 61 | 51 | 37 | 27 | 20 | 12 |
| 25 Years | 100 | 100 | 85 | 65 | 50 | 37 | 30 | 22 | 7 | 2 |
| 30 Years | 100 | 98 | 83 | 68 | 49 | 34 | 22 | 7 | 2 | 0 |
| 50% Stocks-50% Bonds | ||||||||||
| 15 Years | 100 | 100 | 100 | 93 | 79 | 64 | 50 | 32 | 23 | 13 |
| 20 Years | 100 | 100 | 90 | 75 | 55 | 33 | 22 | 10 | 0 | 0 |
| 25 Years | 100 | 100 | 80 | 57 | 37 | 20 | 7 | 0 | 0 | 0 |
| 30 Years | 100 | 95 | 76 | 51 | 17 | 5 | 0 | 0 | 0 | 0 |
| 25% Stocks-75% Bonds | ||||||||||
| 15 Years | 100 | 100 | 100 | 89 | 70 | 50 | 32 | 18 | 13 | 7 |
| 20 Years | 100 | 100 | 82 | 47 | 31 | 16 | 8 | 4 | 0 | 0 |
| 25 Years | 100 | 93 | 48 | 24 | 15 | 4 | 2 | 0 | 0 | 0 |
| 30 Years | 100 | 71 | 27 | 20 | 5 | 0 | 0 | 0 | 0 | 0 |
| 100% Bonds | ||||||||||
| 15 Years | 100 | 100 | 100 | 71 | 39 | 21 | 18 | 16 | 14 | 9 |
| 20 Years | 100 | 90 | 47 | 20 | 14 | 12 | 10 | 2 | 0 | 0 |
| 25 Years | 100 | 46 | 17 | 15 | 11 | 2 | 0 | 0 | 0 | 0 |
| 30 Years | 80 | 20 | 17 | 12 | 0 | 0 | 0 | 0 | 0 | 0 |
The Trinity Study Tables
Table 4:
Terminal
Value of a $1,000 Portfolio after Annual Withdrawals: All Payout Periods from 1926 to 1995
Note: Numbers in the table are rounded to the nearest dollar amount. The number of overlapping 15-year payout periods from 1926 to 1995, inclusively, is 56; 20-year periods, 51; 25-year periods, 46; 30-year periods, 41. Based on all past payout periods, the statistical values for each case represent the mean, the arithmetic average terminal value; minimum, the smallest terminal value; 25%, the lower quartile; median, the 50th percentile; 75%, the upper quartile; and maximum, the largest terminal value.
Data source: Calculations based on data from Ibbotson Associates.
|
as a % of Initial Portfolio Value |
||||||||||||
|
25 % Bonds |
50 % Bonds |
75% Bonds |
||||||||||
| Payout Period |
4 | 5 | 6 | 7 | 4 | 5 | 6 | 7 | 4 | 5 | 6 | 7 |
| 15 Years | ||||||||||||
| Mean | 2964 | 2631 | 2297 | 1970 | 2285 | 1992 | 1698 | 1405 | 1755 | 1496 | 1236 | 977 |
| Minimum | 493 | 249 | 5 | 0 | 855 | 615 | 375 | 135 | 969 | 756 | 542 | 327 |
| 25% | 1567 | 1336 | 1050 | 798 | 1402 | 1186 | 969 | 727 | 1192 | 962 | 735 | 520 |
| Median | 2727 | 2328 | 1909 | 1543 | 2086 | 1770 | 1472 | 1175 | 1422 | 1198 | 951 | 727 |
| 75% | 4487 | 4068 | 3608 | 3213 | 2670 | 2345 | 2045 | 1774 | 1804 | 1568 | 1332 | 1048 |
| Maximum | 6417 | 5919 | 5421 | 4923 | 5554 | 5103 | 4652 | 4202 | 5321 | 4898 | 4474 | 4051 |
| 20 Years | ||||||||||||
| Mean | 4239 | 3628 | 3026 | 2435 | 2954 | 2449 | 1944 | 1443 | 2026 | 1606 | 1185 | 765 |
| Minimum | 536 | 108 | 0 | 0 | 975 | 587 | 199 | 0 | 1019 | 744 | 451 | 110 |
| 25% | 2384 | 1849 | 1346 | 915 | 1919 | 1486 | 1056 | 688 | 1407 | 1031 | 670 | 307 |
| Median | 4481 | 3752 | 2914 | 2076 | 2755 | 2291 | 1798 | 1309 | 1505 | 1164 | 824 | 502 |
| 75% | 5618 | 5034 | 4397 | 3554 | 3547 | 3041 | 2561 | 2024 | 2002 | 1573 | 1166 | 758 |
| Maximum | 9484 | 8672 | 7859 | 7047 | 7512 | 6769 | 6025 | 5282 | 5965 | 5168 | 4422 | 3746 |
| 25 Years | ||||||||||||
| Mean | 6031 | 4995 | 3991 | 3016 | 3815 | 3007 | 2199 | 1416 | 2307 | 1672 | 1036 | 424 |
| Minimum | 785 | 0 | 0 | 0 | 1340 | 655 | 0 | 0 | 1203 | 736 | 269 | 0 |
| 25% | 4138 | 2995 | 2019 | 1223 | 3035 | 2294 | 1447 | 634 |
1626
|
1129
|
643
|
11
|
| Median | 5574 | 4483 | 3710 | 2636 | 3568 | 2706 | 2058 | 1381 |
1850
|
1325
|
787
|
200
|
| 75% | 8016 | 6943 | 5972 | 4295 | 4582 | 3857 | 2930 | 2013 |
2564
|
1714
|
971
|
415
|
| Maximum | 11534 | 10418 | 9301 | 8185 | 8109 | 6624 | 5138 | 3652 |
6795
|
5492
|
4188
|
2997
|
| 30 Years | ||||||||||||
| Mean | 9031 | 7367 | 5779 | 4262 | 5171 | 3936 | 2712 | 1553 |
2645
|
1724
|
803
|
122
|
| Minimum | 1497 | 0 | 0 | 0 | 2151 | 870 | 0 | 0 |
1428
|
729
|
29
|
0
|
| 25% | 6998 | 5461 | 3490 | 1962 | 4174 | 3200 | 2036 | 730 |
1917
|
1182
|
527
|
0
|
| Median | 8515 | 6868 | 5586 | 3745 | 5171 | 4041 | 2610 | 1251 | 2245 | 1481 | 806 | 0 |
| 75% | 10134 | 9037 | 7804 | 6486 | 6046 | 4541 | 3377 | 2487 | 3399 | 2162 | 964 | 58 |
| Maximum | 16893 | 14980 | 13067 | 11245 | 8423 | 7212 | 6001 | 4790 | 5407 | 3451 | 2080 | 1330 |

Leave a Reply